The bar graph shows the favourite colours of 20 student
|
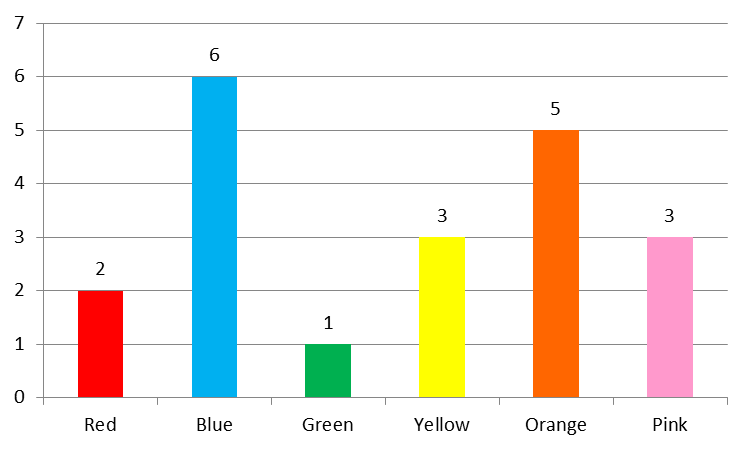
The bar graph shows the favourite colours of 20 students in a class. How many liked blue than pink?
A.
5
B.
2
C.
3
D.
4
Please scroll down to see the correct answer and solution guide.
Right Answer is: C
SOLUTION
From the graph, we observed that
6 students likes blue color.
3 students likes pink color.
∴ the number of students who like blue than pink are = (6 - 3) = 3
