The stress-strain curve for mild steel is shown in the figure giv
The stress-strain curve for mild steel is shown in the figure given below.
Choose the correct option referring to both the figure and table.

|
A point on the graph |
Description of the point |
|
P |
1. Upper yield point |
|
Q |
2. Ultimate tensile strength |
|
R |
3. Proportional limit |
|
S |
4. Elastic limit |
|
T |
5. Lower yield point |
|
U |
6. Failure |
A. P – 1, Q – 2, R – 3, S – 4, T – 5, U – 6
B. P – 3, Q – 1, R – 4, S – 2, T – 6, U – 5
C. P – 3, Q – 4, R – 1, S – 5, T – 2, U – 6
D. P – 4, Q – 1, R – 5, S – 2, T – 3, U – 6
Please scroll down to see the correct answer and solution guide.
Right Answer is: C
SOLUTION
Concept:
The stress-strain curve for steel is shown below the figure.
By comparing with the above curve, we will get,
P → Proportional limit
Q → Elastic limit
R → Upper yield point
S → Lower yield point
T → Ultimate tensile strength
U → Failure

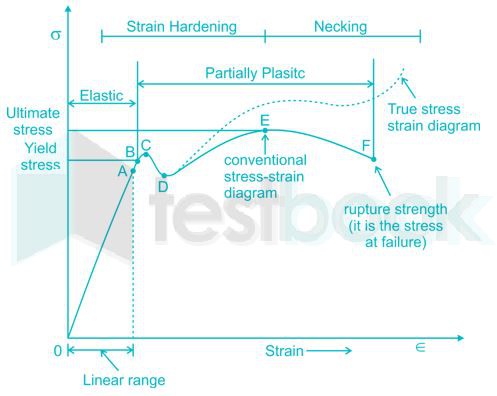
- So it is evident from the graph that the strain is proportional to stress or elongation is proportional to the load giving a straight-line relationship. This law of proportionality is valid up to a point A. Point A is known as the limit of proportionality or the proportionality limit.
- For a short period beyond point A, the material may still be elastic in the sense that the deformations are completely recovered when the load is removed. The limiting point B is termed as Elastic Limit.
- Beyond the elastic limit plastic deformation occurs and strains are not totally recoverable. There will be thus permanent deformation or permanent set when the load is removed. These two points are termed as upper and lower yield points respectively. The stress at the yield point is called the yield strength.
- A further increase in the load will cause marked deformation in the whole volume of the metal. The maximum load which the specimen can withstand without failure is called the load at the ultimate strength. The highest point ‘E' of the diagram corresponds to the ultimate strength of a material.
- Beyond point E, the bar begins to form the neck. The load falling from the maximum until a fracture occurs at F.
